During the reign of Queen Elizabeth II, there were 13 separate bear markets in the U.S. There have been 11 confirmed recessions since the Queen was coronated in 1953, and we are on the verge of a twelfth now. During each of these economic and market downturns, it probably felt like the end of the world. However, with the benefit of hindsight, each of these periods ended up being nothing more than a bump in the road. During the Queen’s reign, the S&P 500 rallied 16,000%, or more than 7.6% annually before dividends. With dividends, the annualized rate of return is over 10% (source: Bespoke Investment Group).
The growing consensus is that we have seen peak inflation. We agree. There are multiple economic indicators that show inflation is on the way down. Here are two:
First, commodities price action has been muted since mid-year, with oil pulling back from $120 to $88, copper prices plunging by about 25%, wheat unwinding its gains since Russia’s invasion of Ukraine, and iron ore (used for manufacturing steel) hitting eight month lows. Global commodity prices are balanced between secular under-supply (driven by weak investment) and cyclical weak demand. China’s property market weakness is significant as well. For iron ore and copper, it is hard for prices to rise when Chinese apartment construction is slowing… until long-term demand sources take over (for example, copper used in electric vehicles).
Second, shipping rates are also indicating the inflationary pressures from tight supply chains are easing. The logjam at the largest ports in California has declined to the lowest level since the bottleneck started two years ago. At the peak in January, there were 109 container ships waiting in queue, but last week there were only eight. This declining amount of traffic at LA ports is also showing up in shipping rates. The Baltic Dry Index, which is a global benchmark for the price of moving raw materials over water, has plunged more than 80% from its post-pandemic peak. Below is a graph of the Baltic Dry Index over the last five years. Notice the recent plunge in prices:
BALTIC DRY INDEX: LAST FIVE YEARS
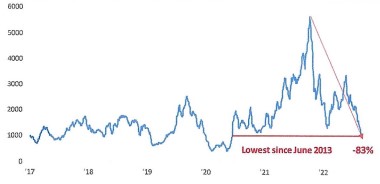
Source: Bespoke Investment Group
“THE RULE OF 20”: WHY VALUATIONS ARE STILL TOO HIGH
The “Rule of 20” is a market valuation formula created in the 1980s. To calculate the “Rule of 20,” we combine the stock market’s P/E ratio and the inflation rate. Over the years, the market has shown a tendency to revert to a sum of 20 for these two metrics. The value of the market is fair when the sum of the P/E ratio and inflation equals 20. In theory, the stock market is undervalued when the sum is below 20 and overvalued when the sum is above 20.
Where does this sum stand today? First, we must decide whether to use trailing or forward P/E ratios and what inflation metric is best. Generally, the CPI is used to gauge inflation. Investors argue about using trailing or forward P/Es, so we will use both in our analysis.
P/Es have dropped significantly this year as stock prices have faltered and earnings have grown. Trailing P/Es have fallen from 27 down to 19, as the graph below shows:
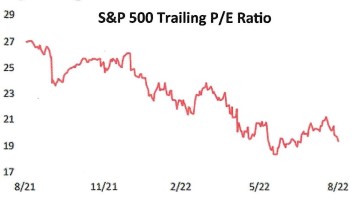
Add the August CPI reading of 8.3%, and you get the sum of 27.3, well above the fair value of 20. Based on this snapshot, the stock market is still overvalued.
Will forward P/Es, which are usually lower because earnings grow over time, give us a different conclusion? The forward 12-month P/E ratio on the S&P 500 is 17. Add 8.3% inflation and the sum is still too high at 25.3. Something has to give. Either stock prices have to come down further if inflation stays high, or inflation must come down to justify today’s P/E level. Our thinking is that we have hit peak inflation (as we mentioned earlier) but how fast will it come down? How sticky is it? This is the market’s dilemma. Can inflation drop to 3% annualized to justify today’s 17x forward P/E for a sum of 20?
Our conclusion is that there are two obstacles to a sustainable rally in stocks: 1) Q3 and 2023 earnings estimates are being cut which will adjust the P/E higher, and 2) it will take a while for inflation to drop to 3% or less.
The “Rule of 20” is just one way to look at market valuations. But over time, it has shown to be accurate. Over the last 50 years, the average P/E is just below 16x with an average inflation rate of 4%. The average sum, as expected, is close to 20.