In January we wrote the “three-headed monster” (courtesy of Bespoke Investment Group) was flashing green. The three variables – oil, Treasury yields, and the dollar – were all in downtrends which bodes well for stocks.  In the last three weeks we have seen a massive reversal.  All three variables are now moving higher including a spike in oil following the U.S. attack on Iran.  Making matters worse, the potentially inflationary implications of higher oil prices have also pushed Treasury yields higher and the dollar has rallied on a flight to safety trade.

Below is a graph of the average level of the three variables combined over the last year.  Notice the recent spike:

                3-Headed Monsters Average Level Relative to 52-Wk Range (%):  Last 12 Months

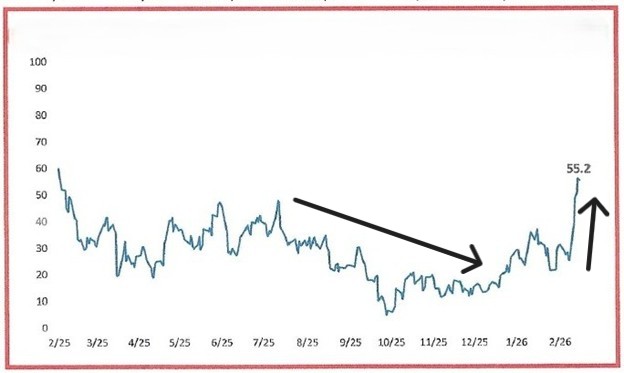
Source:  Bespoke Investment Group

This model is telling us we have serious market headwinds while we are at war.  No surprise.  The trend may have to change before we can expect a firmer stock market.

OIL PRICES UP.  STOCKS DOWN.


Oil up.  Stocks down.  It has been that simple.  The war in the Middle East has made energy prices the market’s sole focus, crowding out earnings, interest rates, economic data, AI or issues in private credit.  If oil falls on signs the Strait of Hormuz supply constraints are easing, we expect a rally in stocks.  If oil prices continue to climb, it signals a continuation of the bottleneck.  If that is the case, the economic consequences will be difficult to contain regardless of how insulated the U.S. economy is versus most of its global peers.

The main question is how long the Iran conflict lasts.  The question is not just academic.  Core inflation came in hotter than expected last week and higher oil prices will likely jack up future headline numbers.  That complicates matters for the Fed, which might like to lower interest rates to boost a cooling job market, but its hands might be tied.  Already the expectation of the next rate cut has been pushed out to the second half of the year.

Last week Q4 GDP growth was revised down from 1.4% to 0.7%.  With such meager growth does this mean higher oil may tip us into a recession.  After all, two of the four recessions since the late 1980s followed spikes in crude oil.  Not so fast.  GDP growth in Q4 was negatively affected by the government shutdown taking away 116 basis points (1.16%) of growth.  Excluding the federal government shutdown, growth would have been closer to 2%.  Government spending should be a tailwind this quarter even with the current partial shutdown.  And AI also remains a significant tailwind but, as usual, consumption is the key driver of U.S. growth.

Also, U.S. consumers are much less exposed to oil prices than they have been in the past.  For example, personal consumption expenditures on vehicle fuel are under 2% of total outlays, compared to 3.5% in the early 2010s.  In other words, the risks of higher oil prices are lower for consumer spending that has historically been the case.

Don’t let the narrow trading range of the S&P 500 fool you into thinking it has been a quiet year for stocks.  There has been massive dispersion.  The S&P 500 may be within 5% of its 52-week high, but more than 100 stocks are up or down at least 20%.  Eight of the eleven sectors are experiencing larger drawdowns than the index.  Breadth is awful.  Dull market?  Anything but.

There has been no panic in the equity markets or the fixed income markets, a good sign.  Maybe just a minor price re-setting.  That is not to say things can’t get worse.  The war is at a critical juncture with the Strait of Hormuz closed.  Can we re-open the Strait without using ground troops?  That possibility is making investors nervous.  The war, however, won’t go on forever.  And when it ends, the stock market could resume its winning ways off a base of lower share prices – or at least return to more typical fundamental concerns.  We will sit tight during this uncertain period.  It is never a good idea to trade based on headlines.

Knowledge – Results

Experts in Risk Management

Are you prepared for the next market correction or financial crisis?

Knowledge – Results

Experts in Risk Management

Are you prepared for the next market correction or financial crisis?

Knowledge – Results

Experts in Risk Management

Are you prepared for the next market correction or financial crisis?

Knowledge – Results

Experts in Risk Management

Are you prepared for the next market correction or financial crisis?

Real Retirement Solutions

designed to improve
  • Wealth Preservation
  • Management of Risky Assets
  • Peace of Mind

This is achieved through an ongoing assessment of market risks given your specific financial situation and goals.

Get Started

Professional Expertise

Leadership Team

Richard Furmanski

Richard Furmanski

CFA

has been a portfolio manager and analyst for over 35 years. He manages conservative, tax-efficient portfolios for both pre-retirees and retirees. His lower risk approach appeals to investors who want less volatility and competitive risk-adjusted returns.

View full bio

Mary Ellen Adam

Mary Ellen Adam

Director of Operations

has been in office administration for over twenty years. Her experience includes customer service, firm operations, and office administration. She interacts with our clients on a day-to-day basis and handles any requests that may arise.

View full bio

Frequently Asked Questions

If you can't find the answer to your questions here, feel free to give us a call at 847-847-2505

Do you manage both stock and bond portfolios?

Yes. We build a portfolio of conservative, high-quality stocks and hold them for the long-term. The average holding period is 4 – 5 years. Our focus is on stocks that are suitable for retirement portfolios.

Our high-quality bond portfolios are designed to provide both income and stability of principal. Bonds provide the anchor for balanced accounts (those holding both stocks and bonds).

What is your investment philosophy?
We take great care in purchasing only high-quality stocks and bonds intent on a multi-year holding period. Portfolio turnover and taxable realized gains are modest in comparison to other active managers. We do not time the market but will become more defensive, in terms of stock holdings, when market conditions warrant.
Will the portfolio be managed in accordance with my financial goals?
Yes. Each of our clients has a custom-tailored portfolio. These custom portfolios are designed to meet specific client objectives with a thoughtful approach to specific constraints such as risk tolerance. And as each client’s situation changes, the portfolio does as well. There is no cookie cutter approach.
What kind of expertise do you have and how can that help me in difficult markets?
We have been working with high-net-worth clients like you since 1982. Over that time we have helped them to navigate several bear markets and financial crises (including the stock market crash of 1987). We hold the Chartered Financial Analyst (CFA) and Certified Financial Planner (CFP) designations.
Are you sensitive to taxes when managing portfolios?
Yes. Our holding period for an individual stock averages 4 plus years which means our turnover is low and realized gains can be carefully managed. Further, where possible, we tax loss harvest small losses as a way of offsetting gains taken elsewhere in the portfolio.
How have you performed?
Results will differ by client and the level of customization but we have provided competitive investment returns for many years.
How do you charge for your services?
We charge a management or consultant fee based upon the size and level of customization of the account. As the account grows, we benefit together.

Recent Commentaries

Stay up to date with all of our latest comments and analysis.

April 2026 Market Commentary

EARNINGS DRIVE STOCKS, NOT HEADLINES The drawdown in stocks has been accelerating since our last commentary.  Through...

February 2026 Market Commentary

January was a battle between high quality stocks and lower quality stocks. Lower quality stocks won.  That includes small and micro caps.  (Our view is that the primary small cap stock index, the Russell 2000, is a low-quality index.  About 40% of stocks in the index...

January 2026 Market Commentary

THE INVESTMENT LANDSCAPE FOR 2026 Happy New Year!  The beginning of a new year is as good a time as any to take an inventory of important variables affecting investors and to see what the investment landscape looks like.  The summary below attempts to do just that....

December 2025 Market Commentary

Current retail investor sentiment is mostly mixed so not much to be taken from that. However, one indicator stands out.  Last week the CNN Fear and Greed Index was sitting at one of its most “extreme fear” levels of the year – see below. Source:  CNN Remember that...

Monthly Updates

April 2026 Mid-Month Recap

If you find that your portfolio’s investment returns are dominated by a small handful of stocks, you are not alone. We have experienced the same thing. Burton Malkiel (renowned author of the classic “A Random Walk Down Wall Street”) did a recent study about this...

February 2026 Mid-Month Recap

U.S. small caps and international stocks are leading the performance race so far in 2026. In the U.S. market, large cap value is outperforming large cap growth.  Growth stocks are struggling – down 3% this year and down 8.6% since the Nasdaq peak on October 29th of...

As a current or near term retiree you have real concerns…

We provide dedicated solutions
Contact Us