EARNINGS DRIVE STOCKS, NOT HEADLINES

The drawdown in stocks has been accelerating since our last commentary.  Through yesterday the S&P 500 is down 7.3% YTD and Nasdaq 10.5%.  The average stock in the S&P 500 is down over 20% since the market peak late last year.  War has been the catalyst for the March decline but it is important to remember the primary catalyst for stock prices over the long term is earnings.  After all, the war will eventually end and investors will then focus again on market fundamentals including earnings.  We are pleased to see that S&P 500 earnings estimates are going up for 2026 and are now expected to rise 17% this year – up from a 15% forecast for growth at the beginning of the year (source:  FactSet).  The earnings backdrop is currently a solid tailwind for stocks.

The combination of lower share prices and higher earnings estimates are driving valuations considerably lower.  For example, the S&P 500 was trading at 23x forward earnings last fall compared to 19x forward today.  The tech sector’s forward P/E has dropped from 30+ to 20, the same valuation it was at in 2019.  Valuations are no longer rich.

Other key positives include:

  • AI is not going away. The AI boom turned “bubbly” in 2025 but has had a much needed rest after the huge rally we saw last year.
  • Both initial and continuing jobless claims, good measures of employment, are not suggestive of any significant weakness in the job market.
  • AI’s impact on productivity is likely positive. Strong per worker output growth creates an incentive to hire more workers.  Generally speaking, periods of high productivity subsequently lead to strong hiring.  This is contrary to the narrative about AI job losses.
  • Investor sentiment, a contrarian indicator, was bullish at the end of 2025 but the bears have since come out of hibernation. For example, CNN’s Fear and Greed Index has fallen into “Extreme Fear,” a potentially bullish signal.  See below:
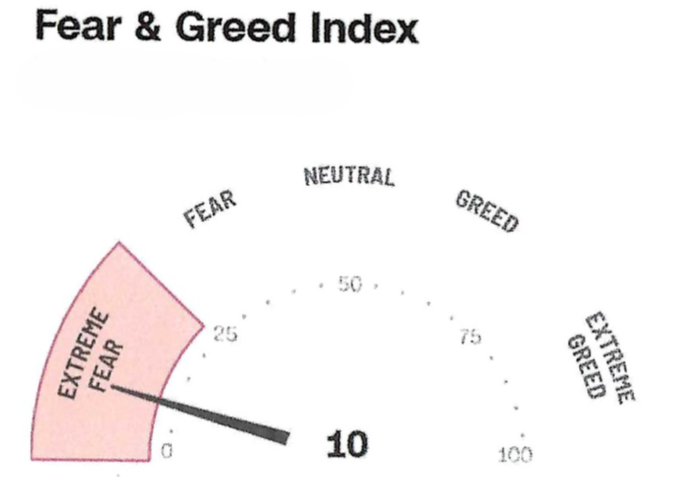
 

Source:  CNN

  • The S&P 500 is currently in extreme oversold territory and upside mean reversion will occur at some point.


We have to also acknowledge there is plenty going wrong right now in both the equity and fixed income markets.  Here are a few lowlights:

  • Market technicals are decidedly bearish. We have seen nothing but lower highs and lower lows since the war began.  We will need to see higher highs and higher lows again for the technical backdrop to turn more bullish.
  • The mega-caps continue to trade terribly. We are going on six plus months of deteriorating technicals.   Until they can turn things around, it is going to be hard for the broader market to turn higher.
  • Inflation was already above-target before tariffs pressured it higher. And now we have a fresh price shock from the energy markets due to the war in Iran.  How will the Fed react?

    The Fed’s March 18th policy statement left descriptions of the economy mostly unchanged and the war’s effects as uncertain.  The Fed was willing to look through energy prices as long as they did not raise long-term inflation expectations.  But for how long?  The markets are not as sanguine as the Fed appears to be.  Investors are now pricing in a roughly one-in-three chance of a rate hike by year-end thanks to the inflation war has created.  This compares to the market expectation of 2-3 cuts this year back in December.  Higher policy rates would remove one of the pillars of this bull market.  We think the probability of the Fed raising rates is low but is nevertheless a risk.

  • Death by AI is still a fear. Certain companies and industries are expected to be hurt by AI.


——————————-

What should an informed long-term investor do armed with all the market information available today?  After all, things could get worse before they get better.

Above all else, stay invested!

Below are the results of a study showing how investors can’t afford to miss the market’s best days (which often follow the market’s worst days).  The study shows actual market performance over a 20-year period ending in 2018.


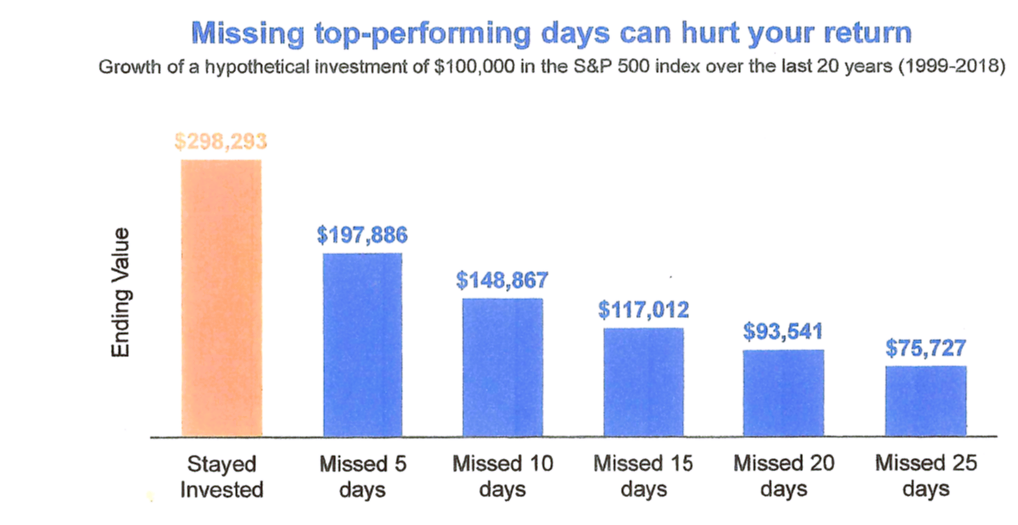
Sources:  Blackrock, Bloomberg

If you stayed fully invested over this time period, your $100,000 initial investment grew to $296,293.  But if you missed just the five best days (over 20 years), your account value would be only $197,866, or 33% less than the fully invested investor.  Missing more of the best days only compounds the problem by punishing the market-timer even more.  The lesson here is a strong one:  market timing doesn’t work.

Knowledge – Results

Experts in Risk Management

Are you prepared for the next market correction or financial crisis?

Knowledge – Results

Experts in Risk Management

Are you prepared for the next market correction or financial crisis?

Knowledge – Results

Experts in Risk Management

Are you prepared for the next market correction or financial crisis?

Knowledge – Results

Experts in Risk Management

Are you prepared for the next market correction or financial crisis?

Real Retirement Solutions

designed to improve
  • Wealth Preservation
  • Management of Risky Assets
  • Peace of Mind

This is achieved through an ongoing assessment of market risks given your specific financial situation and goals.

Get Started

Professional Expertise

Leadership Team

Richard Furmanski

Richard Furmanski

CFA

has been a portfolio manager and analyst for over 35 years. He manages conservative, tax-efficient portfolios for both pre-retirees and retirees. His lower risk approach appeals to investors who want less volatility and competitive risk-adjusted returns.

View full bio

Mary Ellen Adam

Mary Ellen Adam

Director of Operations

has been in office administration for over twenty years. Her experience includes customer service, firm operations, and office administration. She interacts with our clients on a day-to-day basis and handles any requests that may arise.

View full bio

Frequently Asked Questions

If you can't find the answer to your questions here, feel free to give us a call at 847-847-2505

Do you manage both stock and bond portfolios?

Yes. We build a portfolio of conservative, high-quality stocks and hold them for the long-term. The average holding period is 4 – 5 years. Our focus is on stocks that are suitable for retirement portfolios.

Our high-quality bond portfolios are designed to provide both income and stability of principal. Bonds provide the anchor for balanced accounts (those holding both stocks and bonds).

What is your investment philosophy?
We take great care in purchasing only high-quality stocks and bonds intent on a multi-year holding period. Portfolio turnover and taxable realized gains are modest in comparison to other active managers. We do not time the market but will become more defensive, in terms of stock holdings, when market conditions warrant.
Will the portfolio be managed in accordance with my financial goals?
Yes. Each of our clients has a custom-tailored portfolio. These custom portfolios are designed to meet specific client objectives with a thoughtful approach to specific constraints such as risk tolerance. And as each client’s situation changes, the portfolio does as well. There is no cookie cutter approach.
What kind of expertise do you have and how can that help me in difficult markets?
We have been working with high-net-worth clients like you since 1982. Over that time we have helped them to navigate several bear markets and financial crises (including the stock market crash of 1987). We hold the Chartered Financial Analyst (CFA) and Certified Financial Planner (CFP) designations.
Are you sensitive to taxes when managing portfolios?
Yes. Our holding period for an individual stock averages 4 plus years which means our turnover is low and realized gains can be carefully managed. Further, where possible, we tax loss harvest small losses as a way of offsetting gains taken elsewhere in the portfolio.
How have you performed?
Results will differ by client and the level of customization but we have provided competitive investment returns for many years.
How do you charge for your services?
We charge a management or consultant fee based upon the size and level of customization of the account. As the account grows, we benefit together.

Recent Commentaries

Stay up to date with all of our latest comments and analysis.

February 2026 Market Commentary

January was a battle between high quality stocks and lower quality stocks. Lower quality stocks won.  That includes...

January 2026 Market Commentary

THE INVESTMENT LANDSCAPE FOR 2026 Happy New Year!  The beginning of a new year is as good a time as any to take an inventory of important variables affecting investors and to see what the investment landscape looks like.  The summary below attempts to do just that....

December 2025 Market Commentary

Current retail investor sentiment is mostly mixed so not much to be taken from that. However, one indicator stands out.  Last week the CNN Fear and Greed Index was sitting at one of its most “extreme fear” levels of the year – see below. Source:  CNN Remember that...

November 2025 Market Commentary

We are in the heart of earnings season, and it has been an excellent one. About 64% of S&P 500 companies have reported so far.  The latest forecast for the quarter is 10.7% EPS growth, about 5.3% above initial estimates going into the quarter – or about double the...

Monthly Updates

April 2026 Mid-Month Recap

If you find that your portfolio’s investment returns are dominated by a small handful of stocks, you are not alone. We have experienced the same thing. Burton Malkiel (renowned author of the classic “A Random Walk Down Wall Street”) did a recent study about this...

March 2026 Mid-Month Recap

In January we wrote the “three-headed monster” (courtesy of Bespoke Investment Group) was flashing green. The three variables – oil, Treasury yields, and the dollar – were all in downtrends which bodes well for stocks.  In the last three weeks we have seen a massive...

As a current or near term retiree you have real concerns…

We provide dedicated solutions
Contact Us