- The Yale School of Management runs a “crash confidence” sentiment reading (we’ve never seen this index before). The index measures how worried investors are about a stock market crash in the next six months. The Yale Crash Confidence reading suggests that individual investors remain very much on edge. That is the complete opposite from the narrative that day traders are driving stocks higher towards a dot com repeat. Apparently the “wall of worry” is still out there.
- The Q2 earnings season comes to a close this week. EPS beat rates have been very strong coming in above 70%, the strongest since 2004. Forward guidance continues to be as positive as we have ever seen. Companies have set the expectations bar high for the rest of 2020 now that they have raised forecasts so much. Separately, both Wal-Mart and Home Depot reported blowout earnings yesterday, and the stocks opened lower. Are some stocks “priced for perfection?”
- U.S. retail sales, released last Friday for July, are already back to new highs. After the last record high in January, only five months passed until American consumers were back to their pre-COVID spending ways. And this is during a recession! Although the pace of spending is back to record levels, the characteristics of that spending are changing. Online sales now account for 16% of all sales. With a large number of Americans still fearful of leaving their homes, it only makes sense that they would be shifting their spending to online providers. The next largest gains in share have been food and beverage stores. Spending at bars, restaurants, gas stations, and clothing retailers has been weak.
PHYSICAL V. DIGITAL STOCKS – BOTH ON THE MEND

One of our research providers, Bespoke Investment Group, advocates that the days where the importance of the transports acting as a leading indicator for the broader market have given way to the semiconductors acting as the new transports of the digital 21st century. The chart below (source: Bespoke) shows the relative strength of the Dow transports and the Philadelphia semiconductor index versus the S&P 500 over the last year. For each index, a rising line indicates outperformance versus the S&P 500, while a falling line indicates underperformance.
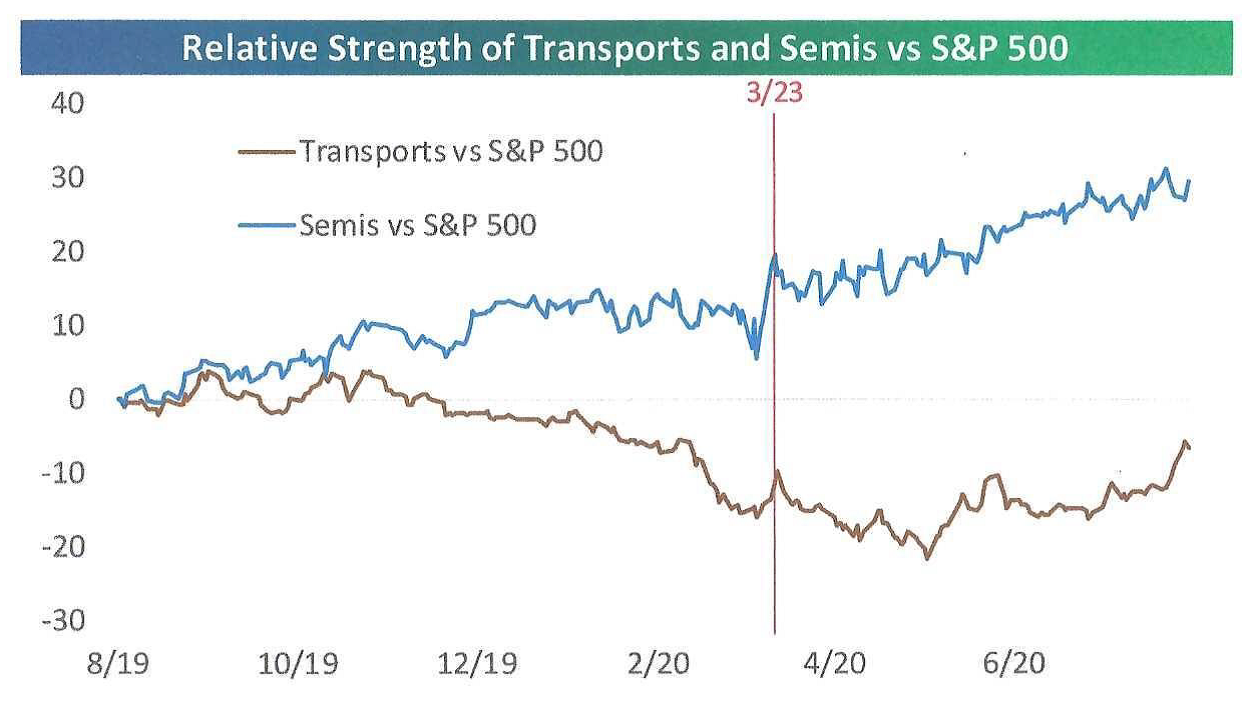
From late 2019 through this past spring, the two indices moved in opposite directions. However, beginning in May, the transports bottomed out and have been outperforming since. With both indices now trending higher versus the market, it seems to be sending a signal that both the physical and digital economies are on the mend. There are two other take-aways from this graph: First, old economy stocks (which includes transports) can do well even in a digital world (which includes semiconductors). Diversification with both old and new is important. Second, breadth in the market is increasing. Skeptical investors who say there is little participation in this historic rally besides tech stocks are now seeing the stock market broaden, a very good sign.