At Clearview, we recommend that investors reduce their exposure to equity portfolios as they approach retirement. There are good reasons for doing so: retirement funds can’t easily be replaced and investors usually want less portfolio volatility in their retirement years. However, what we have found in our research is that most investors should have balanced portfolios and this also applies to younger investors not yet near retirement age. Only the most aggressive investors should have all equity portfolios – those investors willing to tolerate extremely volatile stock market returns. Here’s why:
First, differences in returns over time between all stock and balanced accounts are not large (all data in this paper is from Ibbotson SBBI, 2014 Classing Yearbook, data is from 1926-2013).
| Geometric Annual Return | Standard Deviation | Sharpe Ratio | |
| 100% Large Company Stocks | 10.1% | 20.2% | .33 |
| 70% Stocks/30% Bonds | 9.1% | 14.4% | .39 |
| 50% Stocks/50% Bonds | 8.3% | 11.2% | .43 |
This table shows the historical difference in annual returns between an all stock portfolio and a portfolio 70% in stocks is 1% per year. An additional 1% per year compounded adds up over time but the extra risk taken must be considered as well. Risk (volatility) is measured by standard deviation which calculates how spread out numbers are around an average return. The higher the number, the greater the volatility. As you would expect, the standard deviation is highest for an all stock portfolio.
Now let’s blend risk and return. The Sharpe ratio is a measure of risk adjusted returns that takes into account volatility as well as reward. A higher number shows a better risk-reward relationship. As you can see, both the 50%/50% mix and 70%/30% mix show a higher Sharpe ratio than all stock portfolio.
Next, let’s take a look at more recent returns including periods of both weak and strong stock market returns.
| 1970s | 1980s | 1990s | 2000s | |
| 100% Stocks | 5.9% | 17.6% | 18.2% | (0.9)% |
| 70%/30% | 6.0% | 16.5% | 15.5% | 2.1% |
| 50%/50% | 6.0% | 15.5% | 13.6% | 3.9% |
In low return decades like the 1970s and 2000s, a 50/50 mix outperformed all stock portfolios. In high return decades, an all stock portfolio won the race as expected but the balanced accoutn returns were still very impressive.
Finally, let’s look at best worst years for each mix as well as how often each mix generates positive returns.
| Best Annual Return | Worst Annual Return | % Positive Annual Returns | |
| 100% Stocks | 53.99% | (43.34)% | 64 |
| 70%/30% | 38.68% | (32.31)% | 67 |
| 50%/50% | 34.71% | (24.70)% | 69 |
It is interesting to note that balanced accounts have generated a greater percentage of positive years than all stock accounts. In addition, balanced accounts have consistently supported a narrower range of outcomes between best and worst years.
In summary, over time investors give up little by owning a balanced portfolio instead of an all stock portfolio. In fact on a risk-reward basis, balanced portfolios provide investors with a better adjusted return with less volatility. The risk-reward return associated with balanced portfolios is therefore considered the better solution by most investment advisor professionals. At Clearview our focus is on serving mature investors, often those retired or preparing to retire. We will continue to structure balanced portfolios in accordance with specific client objectives and historical risk and return tradeoffs. But even for the majority of younger investors, over time, a balanced porfolio should provide a better strategy.
Large Cap Stocks: The Foundation of Retirement Portfolios
The definitions of “large cap” and “small cap” stocks are generally understood by their names. Large capitalization stocks are shares of bigger companies as measured by the total value of shares outstanding (number of shares times share price). Large cap stocks have market capitalizations over $10 billion, mid caps $2 – 10 billion, and small caps under $2 billion. Different cap sizes are important to investors, especially those retired or preparing to retire.
Large cap companies tend to be proven, stable companies that are considered “blue chips.” These firms have been around a long while and thus have experienced multiple recessions. A few examples are General Electric, IBM, and Johnson & Johnson. The business performance of large companies is usually more consistent than smaller companies, and their share prices generally don’t get beat up as badly in bear markets. Large cap companies are often shareholder friendly. That is, they pay dividends and buy back stock. Large cap companies account for about 70% of the stock market’s total value.
Small cap companies tend to offer faster growth (earnings, revenues, and cash flow) but also have more volatile stock prices. They tend to perform best coming out of recessions but their share prices can be pummeled in bear markets. Small cap companies have management teams with less experience dealing with recessions and don’t tend to be as diversified as large caps.
Which cap sizes perform better over time? From 1926-2013, large caps returned 10.1% annually while small caps averaged an annual return of 12.3%. However, small caps had much more volatility (risk) than large caps as measured by standard deviation. Standard deviation is a risk measure that calculates how spread out numbers are around an average return. When you take both risk and return into account, large caps provide the better risk-adjusted return (as measured by the Sharpe ratio).
Why are large caps more appropriate for serious minded, conservative, retirement portfolios? Retired investors typically don’t have the opportunity to replace capital that is foolishly invested and lost. Rather, retired investors (and those preparing to retire) should strive for steady accumulation over spectacular short term results. Large cap stocks tend to be much more stable than small caps. Although they also decline in bear markets, widespread institutional ownership helps keep their prices stable.
Clearview emphasizes large caps in all three of the equity strategies it manages. For example, the average market cap of CORE equity holdings is $97 billion with a median market cap of $63 billion (as of July ’14). An occasional mid cap stock may be purchased, but it must represent an exceptional opportunity. We will continue to focus on large caps because they are a more appropriate form of stock exposure for the client portfolios we manage.
Why We Invest in Both Growth and Value Stocks
You have probably heard some stocks described as value stocks while others are identified as growth stocks. Some investors and many advisory firms emphasize only one style and shun the other. What is the difference between a growth stock and a value stock? Why does it matter? Which style performs better? Should you own one over another in your portfolio? We will explain our discipline.
Let’s start with a definition of each style. First, growth stocks are usually high quality, successful companies that are expected to continue to grow earnings (and often revenues and cash flow) at an above average rate (10% +) relative to the market. A growth company is usually a “story” stock. That is, they have some sort of competitive advantage such as a new product, overseas expansion, or a breakthrough patent. It is more common for growth companies to reinvest retained earnings in capital projects than to pay out dividends to shareholders. Growth stocks tend to trade at higher valuation ratios (price to earnings, price to sales, price to cash flow, and price to book value) in expectation of higher profit growth. Growth stocks are considered more risky than value stocks because a slowdown in growth will disappoint investors and often cause the share price to stagnate or fall.
Value stocks are those that investors believe are undervalued by the market and are considered bargains. The share price should rise when the market realizes their full potential. Value stocks are often “bruised” because of a perceived business problem that has raised concerns about their long term prospects. They tend to trade at a lower price relative to their fundamentals (profits, dividends, sales, cash flow) reflecting a slower growth rate and uncertainty. Value stocks provide greater safety than growth and are often considered more shareholder friendly focusing more on dividends and share buybacks.
Growth and value are styles of investing in stocks and tend to run in cycles. Their performance, as measured by growth/value style indices, has differed significantly over the past 30 years. There have been multi-year periods of performance by one style that were followed by multi-year periods of outperformance by the other style. For example, since 1982, growth has outperformed value in 1982, 1985, 1987, 1989-91, 1995-99 (dot.com era), 2007, and 2010. Value stocks have done better the rest of the years including 2013’s 30% + advance.
So which style is the winner over time? In a study conducted by two highly respected finance scholars, Eugene Fama and Ken French, large value stocks outperformed large growth stocks over the 1928-2004 period. Given these results, it might be tempting to use only value stocks. But our discipline uses both for three reasons:
Why We Invest in Both Growth and Value Stocks
-First, selecting from a universe of both growth and value increases the number of stocks to choose from. After one style has had a multi-year outperformance run, many times the best values to be purchased are in the other style. Investors should keep their options open in order to increase the probability of success.
-Second, a truly diversified portfolio has both value and growth stocks. Diversification is important for all investors but especially those with an objective of principal preservation. Diversification does not necessarily reduce investment performance but does manage risk more effectively than concentrations.
-Third, investing in both growth and value stocks can smooth out the performance cycle returns and thus lowers the volatility of returns. Knowing which style will outperform this year or next is never predictable so it makes sense to invest in both styles as a way of smoothing out the performance ride. Investors buying only the out of favor style could have several years of relative underperformance.
–
In summary, Clearview’s equity style includes a mix of growth and value stocks. We focus our purchases in the style that offers the better opportunity. Diversification is very important to us as long term investors as is the smoothing of investment returns over unpredictable style performance cycles.
All stock investors love a bull market. Many of these same stockholders wish they could be invested in stocks only when they are rising. Unfortunately, properly timing when to own stocks has proven nearly impossible and thus is only wishful thinking.
Mr. Market has a mind of his own and is nearly always unpredictable. The reality that large market returns often occur in short, seemingly random bursts (like 2013) is not commonly recognized. However, as the chart below demonstrates, this is in fact the case. The message for investors is that missing the best performing days in the market will substantially reduce the long-term return of a portfolio.
Missing The Market’s Best Days 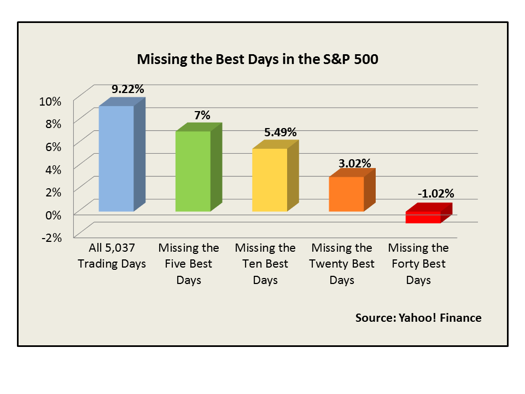
20 Years (1/1/94 – 12/31/13)
Annualized Return
All 5037 trading days 9.22 %
Miss the FIVE best days 7.00 %
Miss the TEN best days 5.49 %
Miss the TWENTY best days 3.02 %
Miss the FORTY best days (1.02 %)
As the chart indicates, if an investor were to have missed the five best performing trading days over the past 20 years the average annual return would have been diminished from 9.22% to 7.00%. That is a loss in annual return of over two percent. Having missed the top 20 days would have reduced the return by over six percent to 3.02% or about the same as
a Treasury bond yield. Finally, missing the top 40 most beneficial trading days , or about 2 days per year, would have offset all of the other positive returns of the past twenty years leaving the investor with a negative average annual return!
At Clearview Wealth Solutions we believe that the bigger risk for investors is not being in but rather being out of the market. Investors should have a buy and hold strategy and let time reward them for their patience. Clearly, time invested in the market is more important than trying to time the market. Rick Furmanski, CFA, CFP®