- The five largest stocks in the S&P 500 (Apple, Amazon, Microsoft, Alphabet, and Facebook) have collectively added $1.66 trillion in market cap this year. The other 495 stocks in the index have lost $1.61 trillion in market cap! The average share price increase for the five mega caps is 32% YTD. The performance for the other 495 has averaged (7)% YTD. There has been a laser focus by investors on today’s dominant tech companies which has now brought about very real concerns about their valuations. But today’s high tech command lofty valuations for a reason. These outperformers have established business models, wide “moats” protecting their long-term viability and sustainable competitive advantages. The valuation run-ups may look similar to the 90s tech bubble, but the economic foundations are very different. We expect the biggest to remain outperformers.
- Earnings season is in full swing and is going very well. Overall the numbers have been extremely positive relative to what was expected. So far, 79% of companies have beaten analyst EPS estimates, the highest beat rate since 2001. Forward guidance numbers have been extremely impressive this season as well. When COVID first hit, we either saw companies lower guidance or withdraw guidance altogether. Now we are seeing companies raise 2020 guidance with hardly any companies lowering. Although this is a plus for the stock market, investors are focusing more on 2021 estimates.
WHAT’S IN STORE FOR ACT IV

The bull market rally off the March lows can be broken into three Acts, each with different leadership characteristics. Act I started at the low on March 23rd, went through May 13th, and was led by Technology and at-home names that were least impacted or even benefited from the economic shut-down. Health Care stocks benefited given the race for a vaccine and treatments while bombed out Energy stocks bounced.
Act II spanned nearly a month from May 13th through June 8th. The “re-opening” stocks rallied along with cyclicals in the Industrial sector as well as Financials as the first wave of the COVID outbreak was ebbing.
Act III began in early June as signs emerged that the south and southwest were starting to flare up. As re-openings were rolled back, investors rotated back into Tech, work-from-home, and FANG stocks. Here is a graph of the three Acts, courtesy of Bespoke Investment Group. It shows the three Acts highlighted in different colors:
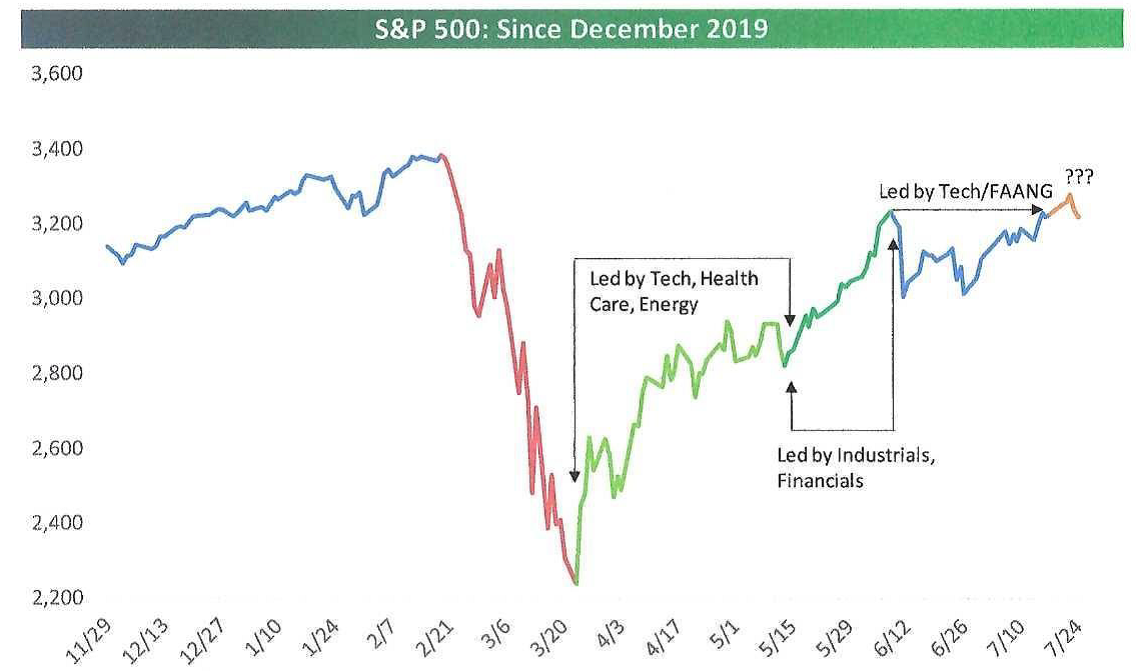
Where do we go from here? Until late last week it looked like we might be starting Act IV; Tech stocks, including FANG, and work-at-home stocks were running out of gas and mean-reverting. But then FANG and other Tech caught fire last Friday and into this week due to great earnings reports last Thursday evening. So Act III continues. What will Act IV look like? Our view is that FANG’s outperformance will continue, and when the current resurgence in COVID subsides, Financials and Industrials will join in. There is still good value in Financials and Industrials which could push the market averages still higher.