- Yesterday the Dow was down 800 points. The primary reason given was that the inversion of the 2 yr – 10 yr Treasury yield curve spooked investors. That is, short-term interest rates are now slightly higher than longer-term rates. This is a very unusual situation and can be a signal for a coming recession. The financial media correctly reported that all recessions in the last 50 years have been preceded by an inversion. But not all inversions lead to recessions. A number of inverted curves gave false signals and eventually reverted to the usual upward-sloping curve – with no recession.
We recognize the probability of a recession in the U.S. may be growing but the economy is still in good shape. GDP growth is expected to be about 2% for this quarter, consumer sentiment and spending remain strong, and many jobs are being created. We are not in the camp that thinks a recession will be here in six to nine months.
- We haven’t written much about the U.S. – China trade war in recent commentaries mostly because we do not plan to change our investment strategy based on a moving target that changes frequently between hope and fear. Despite over a year of consternation, there has been little to act on. How quantifiable is the eventual outcome – particularly without details? And how certain is a deal to pass Congress? Any attempts to profit from shifts in the tradewinds are little more than speculation in our view. One thing we are sure of – we are bound to have choppier markets when we have conflicting anxiety and optimism.
- According to a recent AAII survey, bullish sentiment plunged last week from 35% to 22% – lower than the recent May correction and about in line with last year’s downturns. And bearish sentiment doubled to a level equal to last December’s low. Simultaneous extreme levels of bullish and bearish sentiment have been usually followed by better than average returns for stocks.
- It may be hard to believe given this year’s gains in the equity market, but over the last 12 months, the S&P 500 and long term U.S. Treasury bonds have had nearly identical returns. This graph shows the 12 month relative performance of stocks versus bonds:
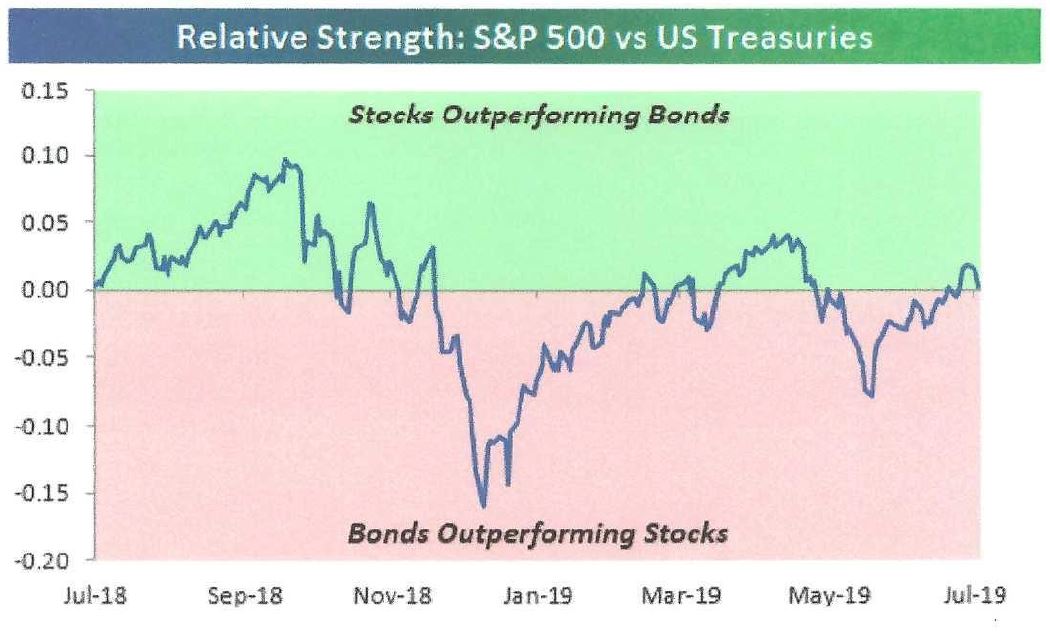
Source: Bespoke Investment Group
When the line is rising, it indicates that stocks are outperforming bonds, while a falling line indicates periods where bonds outperformed stocks.
We buy short and intermediate term bonds in client portfolios. The appreciation in these bonds hasn’t been great as long term bonds this year, but their more conservative nature will better protect principal if interest rates rise from these levels.
With the recent plunge in interest rates, stock yields are very attractive relative to bonds. Currently, 56% of the stocks in the S&P 500 yield more than the 10 year U.S. Treasury note, while over 40% have a higher current yield than the 30 year Treasury (source: Bespoke Investment Group).