One of the main reasons for the recent October/November correction in stock prices is the escalating trade war between China and the U.S. So investors cheered when progress was made last Saturday night at the G20 Summit in Argentina between President Trump and Chinese President Xi Jinping. Their talks did not end the trade war but at least created a ceasefire in the ongoing dispute. There will be no escalation of tariffs on Chinese imports from 10% to 25% on January 1. China agreed to start purchasing agricultural products from U.S. farmers immediately and also agreed to purchase other U.S. energy and industrial products. The two countries also agreed to discuss forced technology transfers, intellectual property protection, non-tariff barriers, cyber intrusions and theft, and gave themselves 90 days to agree to a resolution on these matters. Investors cheered the agreement and drove the stock markets sharply higher yesterday.
In addition, Fed Chairman Powell’s speech last week indicated that interest rates are near neutral (the level at which rates do not spark or slow the economy) and would not likely rise to levels that some investors fear would cause a recession. Investors had two major developments in the last week to clear the way for a possible year-end Santa Claus rally.
There are three primary methods to analyze stocks (and stock indexes): fundamental, quantitative, and technical. We will briefly describe each method but focus on technical analysis, and conclude what it is currently telling us about the stock market.
Fundamental analysis focuses on finding a security’s value by studying financial statements, industry prospects, its competition, macroeconomic variables such as GDP growth, interest rates, Fed policy and inflation among many other factors. Fundamental analysis helps investors determine whether a stock’s price is fair and can be supported by underlying earnings, cash flow, and dividends. Of course, investors search for stocks that appear ‘undervalued’–those worth more than the market price. This is our primary method of analysis, but we also incorporate the next two to make our analysis more comprehensive.
Quantitative analysis is the use of math and statistical methods to evaluate investment opportunities and make decisions. For example, mathematical stock valuations (including ratios) are part of quantitative analysis. Commonly used ratios such as price/earnings, price/sales, and price/book are all considered quantitative in scope. Quantitative methods are often used along with fundamental analysis.
Technical analysis is a methodology that makes buy and sell decisions primarily using charts that show trading history and statistics. Investors start with charts that show price and volume as well as statistical measures such as moving averages. The objective is to use the charts to identify trends and possible changes in those trends. This type of analysis is based on the belief that past market trends can predict future behavior. Enough people believe in technical trading rules that they can become self-fulfilling.
There are dozens of technical measures and trading ‘rules’ but we will focus only on a few critical ones. Below is the YTD chart for the S&P 500. We added the red lines.
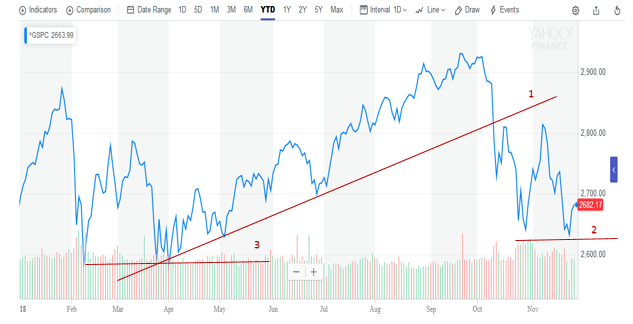
What is the chart telling us?
- The upward sloping trend line (#1) broke the uptrend in early/mid-October which paved the way for more technical selling. The market did not bottom until October 29 at a much lower level.
- The market tested this bottom (#2) on November 23 and then rallied, a successful retest of the October 29 low. A successful retest of a temporary low is healthy because it signals the level buyers will come in.
- If the October 29/November 23 bottom didn’t hold we had another (lower) double bottom in February and April earlier this year (#3). Another successful retest of this lower level would also have been healthy for the same reason–a signal from buyers. If the market continues its upward path in the short-term, the correction is probably over and no other retest is likely. Keep in mind we view this as a non-recession correction and not the start of something worse.
Technical analysis is a tertiary tool that, when combined with fundamental and quantitative methods, can be beneficial in analyzing both markets and individual stocks.
Bond Vigilantes Grow Uncomfortable with GE Bonds
Growing concerns about alarmingly poor management decisions, earnings performance, a growing cash shortage and the possibility of default are now forcing GE management to provide substantially more granular (subsidiary specific) earnings information. This is an ironic twist as one prior CEO, Jack Welch, was the poster child for opacity. In the mid-1980s then newly appointed CEO Welch told Wall Street analysts that GE would no longer provide detail on earnings as long as expectations were met.
Transparency and subsidiary level detail have always provided investors a degree of protection from poorly performing entities. This information is now more important than ever as rising interest rates and quantitative tightening along with a decade of debt binge threaten many over-leveraged corporations. Further, investor protections (or bond covenants) have largely gone away. Transparency will improve as the bond vigilantes grow anxious and firms like GE wrestle with overwhelming debt burdens.
Though GE remains investment grade for now, its bonds trade like high yield (or junk). If it were to be downgraded to junk status (as many believe is likely for the sixth largest debt issuer at $100+ billion) many investment grade investors would be forced to sell. Forced selling could create panic further stressing already anxious credit markets. And GE is not alone in its’ over-indebtedness after a decade of debt indulgence.
Other Corporate Bonds At Risk
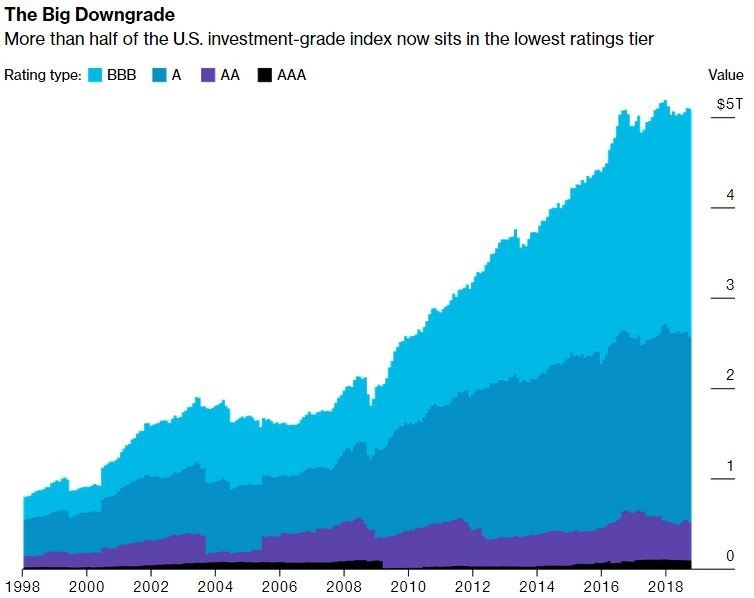
As you can see from the chart above, outstanding investment-grade debt has doubled over the past decade to $5 trillion. Further, half this corporate debts is “BBB,”,or approaching junk status. Throughout the next downturn many highly indebted corporations will find it more difficult to fund themselves–some will likely fail.
Investors have been rewarded over the past decade for speculating in risk assets due to constructive Fed policy including zero interest rates and bond purchases. These policies have been reversed over the past year. While diversified funds of poor quality bonds (ETFs) may be practical when cheap, owning large blocks of weak credits may now be dangerous. Income-dependent retirees, especially those who reached for yield, are sure to be punished for their lack of prudence.
We believe that this will be one of the more damaging debt cycle conclusions in recent history–likely since the late 1930s. We are watching this closely because it may lead to another balance sheet recession not unlike 2007-09 where falling asset prices along with elevated debt levels constrained consumption for several years. In order to protect principal in bond portfolios, we are holding (and buying) only the better investment grade bonds (AA or better) along with U.S. Treasury notes.