One of the drawbacks of stronger economic data for the U.S. economy is that interest rates just won’t stop going up and are near recent highs from last fall. If or when they break these higher levels, the short-term reaction from the stock market will likely be negative. But the equity market isn’t necessarily concerned with where rates are but instead where they are going.
If Fed policy is any indication, there probably isn’t much upside left in yields. The current odds of a hike tomorrow by the Fed have steadily declined to near zero, and the odds of a hike by November are less than 40% (source: the CME Fed Watch tool). Last week’s higher CPI and PPI inflation numbers for August were widely expected and shouldn’t affect Fed policy, in our view.
IF EVER THERE WAS A TYPICAL YEAR IN THE STOCK MARKET … THIS IS IT
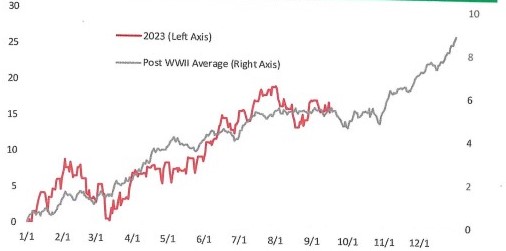
The performance of the S&P 500 this year has followed the script of the annual pattern nearly word for word. That has especially been the case over the last few weeks, and if this continues, we can expect to see additional weakness in the coming weeks. Maybe not optimal in the short-term, but we think the bulls would be happy to put up with a few down weeks to get the typical fourth-quarter rally.
In the graph below, 2023 is the left axis rate of return, and the post WWII Average is the right axis. Notice how the trend lines are almost on top of each other.
S&P 500 YTD Performance vs Post WWII Average (%)

Source: Bespoke Investment Group
If ever there was a typical year, 2023 is it! Will it continue? Who knows? Short-term prices are random, and future trends are, of course, uncertain.
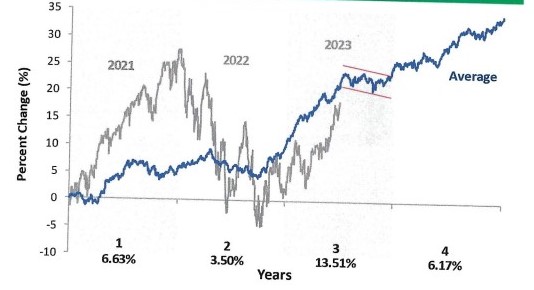
Another interesting comparison is how this year compares to the typical third year of the Presidential cycle since 1928. The blue line charts the typical Presidential cycle. The gray line is the current four year cycle. Note the comparison in the graphs below for year three. Looks like a typical third year in the cycle to us.
S&P 500 Four-Year Presidential Cycle: 1928-2023

Source: Bespoke Investment Group
