P/E Ratios and Bull Markets Let’s take a look at the market’s current P/E ratio (as of June 20) and compare it to past bull market start and end P/E ratios.
|
847-847-2505
P/E Ratios and Bull Markets Let’s take a look at the market’s current P/E ratio (as of June 20) and compare it to past bull market start and end P/E ratios.
|

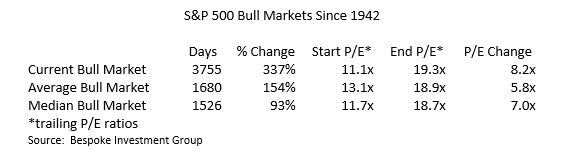 From a valuation perspective, both the level and expansion in P/E ratios that we have seen during this bull market is almost exactly in line with the median start and end P/E ratio seen during all bull markets. Since the current P/E ratio (19.3x) is about equal to both the average and median end P/Es, has the market peaked? Have we reached the end of the bull market? Not necessarily. Keep in mind these are trailing P/Es which do not take into account future earnings growth. While trailing P/Es are informative and helpful, we use forward P/Es because, after all, the markets are forward-looking. For example, the forward P/E for calendar year 2020 is only about 16x, or 17% lower than the current trailing 19.3x. With positive earnings growth forecast in CY 2019 and CY 2020, we don’t think 19.3x is signaling the end of this bull market. By way of further comparison, the current 2020 estimated P/E of 16x compares to the 5-year average P/E of 16.5x and the 10-year average P/E of 14.8x, and is about three multiple points lower than January 2018 at the then all-time high.