It was easy to get wrapped up in all of the negative headlines when stocks hit their bear market low on September 30th. But there were reliable technical factors that indicated the selling had gone too far – at least in the short term. Here are three of those indicators:
– Quantitatively, the market got to extremely oversold levels.
– Investor sentiment showed historic levels of panic. This reliable contrarian indicator came through again although rampant pessimism doesn’t always result in an immediate rally.
– After a pause earlier this year, insider buying has returned with a vengeance: it is comforting to know insiders think their own stock is priced at very buyable levels.
The market had a 5.7% jump on October 3rd and 4th but has since retraced most of that gain. The markets’ concerns remain: inflation, the Fed, and a slowing economy. But do the lower valuations now reflect the widespread negative news out there? More on earnings and valuations later in the main section of this mid-month commentary.
We remember the 1980s when investors would anxiously await the release of the Thursday afternoon money supply figures (M2). Too much M2 growth and fears returned of rampant inflation. Too little growth and fears surfaced that the economy wouldn’t grow at all. Although M2 growth is not as much in focus today, it remains just as important to the long-term health of our economy.
The big surge in the money supply in response to the pandemic provided a positive atmosphere for consumers, but the hangover certainly hasn’t been very enjoyable. In the graph below, notice the surge in money supply growth in 2020/2021 and the lack of any growth now:
M2 Money Supply Six Month Rate of Change (%): 1960-2022
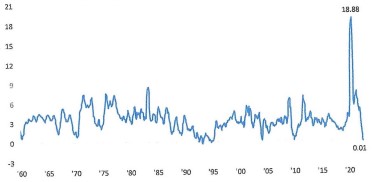
Source: Bespoke Investment Group
Barring an increase next month, the six-month rate of change will likely go negative next month. In addition to rising interest rates, the evaporation of the money supply is a factor in the disappearance of liquidity in the stock market. Lack of money supply growth is consistent with a slowdown in the economy which could lead to recession.
With inflation running at its hottest pace in 40 years, the bond market has taken a drubbing this year. This is the first global bond bear market in 70 years. The aggregate bond market indexes are off about 15% YTD but longer-term bonds are down much more. Long-term U.S. Treasuries are off almost 30%. 30%. Aren’t Treasuries supposed to be safe and boring? Usually when stocks hit the fan, commentary includes something like “investors rotated into the safety and security of Treasuries.” Even Treasurydirect.com, run by the Treasury Department, says as much on its website.
Our thinking is that interest rates are probably near a peak. True, the Fed will continue to drive up short-term rates with more increases to the Fed Funds rate. With more compelling evidence our economy is slowing with a possible recession soon, bond investors may soon react to economic weakness instead of only inflation (which appears to have peaked).
Even though interest rates may be peaking, we continue to hide out in shorter-term Treasuries and Corporates. With an inverted yield curve, short-term rates are very attractive. Short-term Corporates now yield over 4%.
EARNINGS ESTIMATES STILL TOO HIGH
Stocks are more than 20% off their highs with forward valuations 25% off their peak. Regardless of short-term risks, these metrics make today a much more attractive entry point than much of recent history.
Let’s look at earnings, earnings growth rates, and valuations to project where the market may trade under different scenarios.
First, consensus growth rates in earnings are as follows:
2022 Q3 +2.9% (down from an estimated 9.5% three months ago)
2022 Q4 +4.0%
All of 2022 +7.4% (down from an estimated 9% three months ago)
All of 2023 +7.9%
Source: FactSet
Given a slowing economy and sticky inflation, we think 2023 estimates are still too high. Let’s reduce estimates by 10% which may not be conservative enough. The lowered earnings translate into a forward ’23 P/E of about 16x, a fair multiple. If earnings estimates are slashed by more than 10%, then the forward multiple would be higher.
The real question is what P/E multiple the market should trade at on likely reduced earnings estimates. How much downside is there if the market trades at 14x (14x was the trough for the Covid crash and also the 2018 Q4 correction)? By our calculations, the potential downside is 16% putting the S&P 500 at 3000. Likewise, an upward adjustment in the P/E to 18x (due to an eventual Fed pivot?), puts the S&P 500 at 3900, about 9% higher.
Stocks seem to be fairly valued here given an assumed reduction of 10% in consensus earnings for 2023. Of course if earnings estimates get reduced by more than that, there is more potential downside for investors than we have projected.