The stock market continues its amazing run from the December 24th low and is now up about 18% since then. The percentage of stocks in the S&P 500 that are trading above their 50-day moving averages crossed above 90% for the first time in nearly three years. A breadth reading above 90% means there is massive participation across the S&P 500. While positive breadth does not automatically mean high market returns, readings above 90% have historically been bullish for forward returns.
The charts below show the market is still below all-time highs, but the cumulative advance-decline line has broken out to an all-time high (another positive breadth indicator). And the percentage of S&P 500 stocks trading above their 200-day moving average is grinding steadily higher.

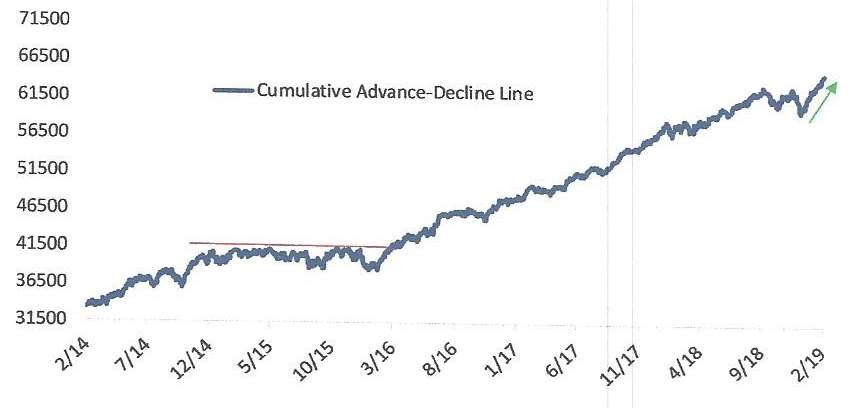
(Source: Bespoke Investment Group)
The rally continues even as earnings growth estimates for 2019 are being sharply reduced. Earnings growth for 2019 is now forecast under 5%, down from 10% entering last year’s fourth quarter. If this trend continues, it’s even possible we will have an ‘earnings recession’ this year.
The question to focus on: has the market overshot to the upside in the first two months of the year, or have earnings projections shot too far to the downside? We think it is a little of both.
New Sector Leadership
Bull runs always have groups (industries or sectors) that lead the market higher. For example, it was the FANG stocks in 2017 that led the 20% advance in the S&P 500. What groups have propelled the market averages higher during its recent surge?
Market Leaders:
2017 – technology stocks (FANG), financials, consumer discretionary
2018 – health care, utilities (both underperformers in 2019)
2019 – industrials, tech (broader than FANG), energy
What’s interesting to us is how these leaders change over time–and that there can be a disconnect between immediate business prospects and market leadership. For example, in the midst of December’s concerns about slowing global growth, industrials first plunged but are now leading the pack higher in 2019. Why would (globally cyclical) industrials be leading the worldwide equity surge this year in the face of declining growth? Or why would health care stocks be the weakest performers this year after leading the sector parade in 2018? The market is not always rational. Some investors bet heavily on certain sectors outperforming in a given period (sector rotators). However, if portfolio returns are being driven by industry or sector bets, these groups can have large reversals.
If sector leadership isn’t always logical and can change in a heartbeat, what should investors do? We stay diversified and weight sectors approximately in line with the market benchmarks. Of course, we all have our favorites–ours include health care stocks, which offer both offensive and defensive characteristics (and positive long-term demographic trends). But to make large incorrect bets over the long-term can devastate portfolio returns. We don’t try to outsmart an often irrational and unpredictable market and instead own a basket of stocks representative of corporate America.