The June CPI (consumer price index) was released last Wednesday. The readings came in at 0.2% month-over-month for both headline and core. We tend to focus more on the headline number that includes food and energy, two important components of consumer spending. On a year-over-year basis, headline inflation dropped to 2.97%, the lowest level since March 2021.
Unfortunately, all good things must come to an end. Looking ahead to the July CPI release in mid-August, unless the CPI deflates, the year-over-year reading will increase. With respect to lowering headline inflation, the easiest work is behind us, and getting down to 2% will be a more difficult task because the easy comparisons are behind us. We are not yet at “mission accomplished.”
That doesn’t mean the Fed has to keep hiking rates. With the Fed Funds rate at 5%, it is already in restrictive territory with its full effects not yet felt by the economy. Based on various Fed members’ speeches, it seems to be a done deal that the Fed Funds rate will increase by 25 bp in late July, but that could very well be the end of the tightening cycle. That would be another bullish signal for the stock market.
When you hear about the market being “overbought,” it is natural to expect a pullback. Actually, forward returns when the market is overbought have been better than the average for periods of one, three, six and twelve months.
Below is a twelve-month graph of the S&P 500 showing we have had 32 straight days of overbought closes. Overbought is defined as one or more standard deviations above the 50-day moving average. It is the boxed area on the graph below. The gray trend line is the 50-day moving average.
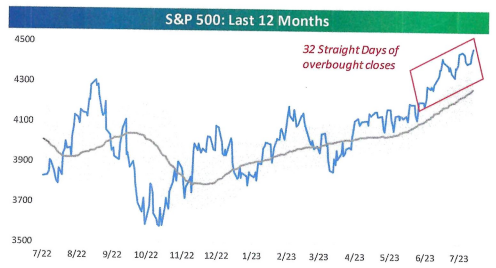
Source: Bespoke Investment Group
The market has been overbought all summer! Overbought markets can continue to trend higher. It seems counterintuitive for the market to experience strong returns following long streaks of overbought readings (like now), but these types of streaks are characteristic of bull markets.
IS THE S&P 500 STOCK INDEX STILL A STOCK MARKET BENCHMARK?
The S&P 500 stock index is the most widely followed market gauge or benchmark for how the U.S. stock market does on both a daily basis and for longer periods as well. When people refer to “the market,” they often mean the S&P 500. But does the S&P 500 stock index truly represent how the broader stock market is moving? No. Not anymore.
The S&P 500 is a market cap-weighted index meaning the larger the company, the more weight it has in the index. In this day of multi-trillion dollar market cap companies, the big companies can dominate the index and not really reflect how most companies’ shares are doing. For example, only two stocks, Apple and Microsoft, account for 14% of the index by market cap. Only seven stocks, “the big 7,” account for 30% of the index’s market cap. Some say this is a sign that we have the most concentrated stock market in the last 40 years. Others say the S&P 500 is no longer a diversified benchmark but rather a tech-heavy large cap growth index – which is true.
Popular benchmarks like the S&P 500 and the Dow Jones Industrial Average (DJIA) will always be used as a market gauge and for an investment performance benchmark for both amateur and professional investors. But are there better indexes out there that more accurately measure the broader market or the average price performance of a stock? Yes there are. We use the following indexes as a more accurate representation of what the broader stock market is really doing:
Unweighted S&P 500 stock index: Instead of the largest cap names driving the index returns, each stock is equally weighted, indicating the average return for each stock is the index.
NYSE Composite Index: Although this index is market cap weighted like the S&P 500, there are over 2000 stocks in the index which better dilutes the effect of the mega-caps. The breadth of this index makes it a far better indicator of performance than narrow indexes that have far fewer components.
Now, let’s look at performance of these various indexes:
|
JULY 14TH YTD |
|
|
|
|
|
STANDARD BENCHMARKS |
|
|
S&P 500 |
17.3% |
|
D.J.I.A. |
4.1% |
|
(there are many others) |
|
|
|
|
|
BROADER MARKET GAUGES |
|
|
Unweighted S&P 500 |
7.2% |
|
NYSE Composite |
5.4% |
Since about June 1, the broader stock market is catching up to the less-diversified S&P 500, but the performance gap is still large between the S&P 500 and the broader market gauges. The average stock portfolio is up 5-7% this year, not the 17% posted by the S&P 500. We will never stop using the S&P 500 as a benchmark, but we think it is important to also look at these broader benchmarks as well.