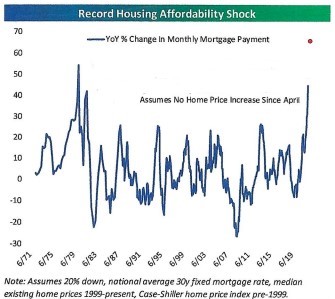
Higher interest rates are not only hitting stock and bond markets, they are also hurting the housing market. Thirty-year fixed mortgage rates are off the recent high of six percent, but mortgage applications are plunging, consistent with an outright collapse in sales activity. The current housing market is in the midst of the worst affordability shock on record. The graph below shows the affordability shock, based on year-over-year percentage change in monthly mortgage payments. This graph shows an even worse shock now than 1981, when interest rates were much higher due to hyperinflation. The red dot is the current monthly mortgage payment increase, about 65%:
Source: Bespoke Investment Group
Housing is an important part of our economy, and its weakness is adding to recession fears. With higher home prices and interest rates likely to stay firm or increase, we may have seen the peak in housing for this cycle. Bears say this will be a contributing factor to the probable recession ahead.
WHAT YIELD CURVES ARE TELLING US
With each passing day, another indicator flashes a warning sign that the economy is already in or heading towards recession. While these indicators may not have perfect prediction records, when more arrows are pointing towards recession, the evidence becomes more convincing.
What about yield curve analysis? After all, the 2s10s (two year Treasury versus ten year Treasury), a common comparison, is now inverted (short rates higher than long rates). Historically, this implies an 85% chance of recession over the next 12 months.
Is it this definitive? No, not really. There are many other yield curves with different maturity comparisons to consider. For example, the 3m10y curve (three month T-bill versus ten year Treasury), the Fed’s preferred measure of the yield curve, has remained positively sloped (although it is flattening somewhat).
Our research shows that it is more about the number of yield curves that are inverted. We reviewed 28 different yield curves (that have varying maturity comparisons) and only three are inverted (2s/10s, 5s/10s, and 20s/30s). So far we have not seen nearly the same percentage of yield curves invert as we have seen in prior recessions dating back 50 years.
Our takeaway is that yield curve analysis is inconclusive. While 2s/10s is inverted, most other curves are not. The full body of evidence does not support a pending recession.