It is still very early to say much definitive about the Omicron variant of COVID. We do know that it has spread beyond the origin, it has a significant number of mutations on the spike protein of the virus, and has relatively high transmissibility. Testing by vaccine manufacturers is underway to assess whether the vaccine formulations are still effective for Omicron. New booster doses that have a shifted formulation could be rolled out in about three months. Whether that is necessary is an open question.
We do not see a major shift in U.S. economic activity as likely unless the new variant is significantly more deadly. The economy continues to be in good shape as we note in the bullet points below. There is not an appetite for widespread restrictions. The vast majority of the population has decided to move on from the pandemic.
Without any real information on Omicron, Wall Street sold off sharply last Friday when the new variant was first announced. In typical fashion, equity investors shoot first and aim later. We expect the market will be very sensitive to future news – in either direction.
The economy continues to be solid. October’s Leading Indicators rose 0.9%, and 9.3% year-over-year. This is a level seen only during a handful of other periods going back to 1959. The graph below shows exactly that:
Leading Indicators Nine Month Rate of Change (%): 1959-20
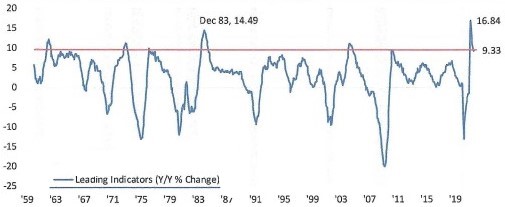
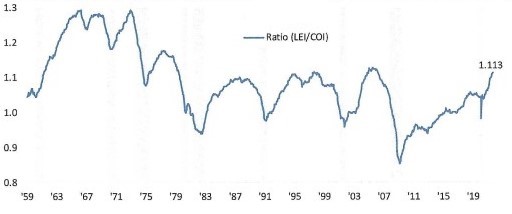
It is also encouraging that the ratio of leading to coincident indicators continues to rise, confirming a very strong economy with no recession in sight.
Ratio of Leading to Coincident Indicators 1959-2021
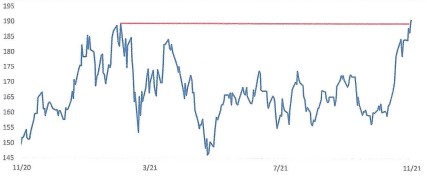
Another gauge that shows the economy is doing well is the performance of the semiconductor industry which we view as a leading indicator; the ‘transports of the 21st’ The Philadelphia Semiconductor Index recently rallied to an all-time high. Also important is the relative strength of semis versus the S&P 500 which is also positive. Relative strength really started to take off in late October hitting a new high last week as shown below. A rising line means semis are outperforming the S&P 500:
Relative Strength: Semis vs S&P 500: Last 12 Months
The performance of small cap stocks is yet another indicator for equity investors. S. small caps have more exposure to economic cyclicality and less exposure to defensive sectors compared to large cap benchmarks like the S&P 500. Small cap performance can indicate where investors think we are in the economic cycle. Small caps do best during an early cycle ‘risk-on’ scenario where economic growth is expected to be robust with cyclical stocks leading the charge. Investors tend to gravitate towards more conservative large caps late in the cycle.
Small caps have been steadily underperforming large caps for the last several years (indicating late cycle). As global equities bottomed in March 2020, small caps outperformed gradually in the early stages of recovery but then took off after the November election. They hit a peak this March then stalled out. At current levels the relative strength of small caps is testing its uptrend from the March 2020 lows, so small caps are at a critical juncture from a technical perspective. We still believe we are in early/mid-cycle and think small caps will outperform large caps over the next few years.