This quarter’s corporate earnings reports have been stellar. With about 40% of S&P 500 companies having now reported, 91% beat analyst expectations, the highest level on record according to Refinitiv. But that doesn’t mean their stock prices rose as a result. In fact, unless a company raised forward guidance, the stock probably treaded water or dropped. Even some stocks that reported ‘triple plays’ (earnings beat, sales beat, raise guidance) traded lower on the next day’s opening (for example, Apple, McDonald’s and Visa). Bears say this is evidence that stocks are ‘priced for perfection.’ We think it is a sign that many individual stocks are in correction mode even though the broader averages are making new highs.
If the Democratic tax bill passes, will it be retroactive to January 1, 2021? There have been several instances in the last 25 years when a new tax act was made retroactive to the first day of the year it was enacted. However, in each of those situations, the retroactive change was a tax reduction. There have been no retroactive situations in the last 25 years when a tax act increased taxes and the effective date was prior to the date of enactment. Why might that be the case? One reason is that tax increases are unpopular and one way to make the tax increase more palatable is to delay its implementation giving individuals advance warning and time to manage their affairs around the effective date.
The stock market continues to make new highs. When will it end? Judging by the pools of cash lying around, it could be a while. Money is piling up in people’s accounts. Money market accounts often viewed as ‘dry powder’ sit at almost $4.5 trillion. A more obscure balance, the Federal Reserve’s count of money on deposit with commercial banks, has risen 33% from 2019 to $17 trillion (source: Bloomberg).
The bar chart below shows that a good portion of this cash is finding its way into stocks. Apparently that $17 trillion is burning a hole in investors’ pockets:
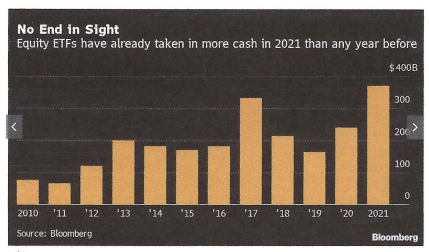
All the cash on the sidelines may help explain why investors are buying the dips in this market advance. They don’t want to be left behind as the major averages hit new highs.
DAY TRADING VERSUS BUY AND HOLD
How do day traders generally perform in the stock market? Is their belief they can outperform the market justified? Given the majority of market-moving headlines occur either after the close or before its open each day, it makes sense that a large portion of the equity market’s overall move would come during after-hours trading.
As the graph below shows, since 1993 when SPY began trading (SPY is a S&P 500 ETF), buying the close and selling the next day’s open results in a cumulative gain of 920%. Sounds pretty good. The real shock, however, is the performance of the intraday strategy. This captures SPY’s cumulative change when the market is open: buying the open and selling the close. Had you done so as a day trader, you would actually be down 2.5% since 1993!
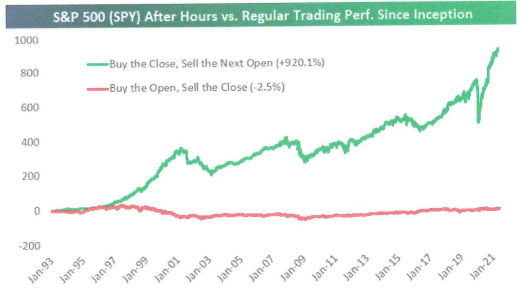
Source: Bespoke Investment Group
The point of this exercise is to show how much of the market’s historical move has occurred outside of regular trading hours – all of it! If a day trader thinks their strategy is a winner versus a ‘buy and hold’ strategy, hopefully this analysis is an eye-opener.