My business partner and co-author of these commentaries, Steve Riley, has decided to leave Clearview to pursue other interests. His many contributions will be missed.
This week marks the anniversary of the January, 2018 fevered peak in stocks. Since then stocks are down 7%, but valuations are down by over 20% to historically average levels. There remains some skepticism of the recent six-week rally in the media, but the further we get from the Christmas Eve low, the more optimistic headlines we see. And the CNN Fear and Greed indicator rose last week back to ‘Greed.’ We would prefer to see investors remain fearful or uneasy so stocks could continue to climb the ‘wall of worry.’ We see the two biggest near-term threats to the market as 1) a significant markdown to current 2019 earnings growth estimates (see section below), and 2) the ongoing trade war with China (which feeds directly into our first concern).
Can 2019 Earnings Drive Stock Prices Higher?
With earnings season about half way through, it has been a mixed bag. Companies reporting earnings above estimates (71%) is above the five year average. Firms reporting revenues above estimates stands at 59%, which is below average. Companies beating EPS forecasts are being rewarded considerably more in magnitude than companies who miss are being punished. Many corporations that generate a significant amount of sales in China (Caterpillar for example) have reported disappointing earnings and outlooks. On the other hand, U.S. railroads (who are not as dependent on China) posted very good results and increased guidance going forward. The divergence by industry has been wide. Let’s look at the actual consensus growth forecasts for the S&P 500 (source: FactSet):
| ESTIMATED GROWTH | ||
| EARNINGS | REVENUES | |
| Q4 20181 | 10.9% | 6.1% |
| CY 2018 | 19.9 | 8.7 |
| CY 2019 | 6.3 | 5.2 |
| CY 2020 | 11.1 | 5.4 |
1 Net profit margins are near a record high at 11.2%
It’s important to note that many 2019 company forecasts are being downgraded. Expected earnings growth of 6.3% for 2019 is respectable for this late in the cycle, but just recently (December 31st) it stood at 7.8%. It was 10% at the end of Q3, 2018. If the bulk of the remaining companies to report dial back their earnings guidance for 2019, it’s a good bet this January rally will stop dead in its tracks. We assume there will be no expansion in P/E multiples this year. Why would the market assign a higher P/E multiple to S&P 500 earnings if earnings growth is being marked down? We don’t think it would.
Next, the graph below charts S&P 500 earnings versus the S&P 500 index for the last 10 years. The chart is busy, but the blue line is the S&P 500 index (left axis shows price level) and the black line is earnings (right axis shows earnings).
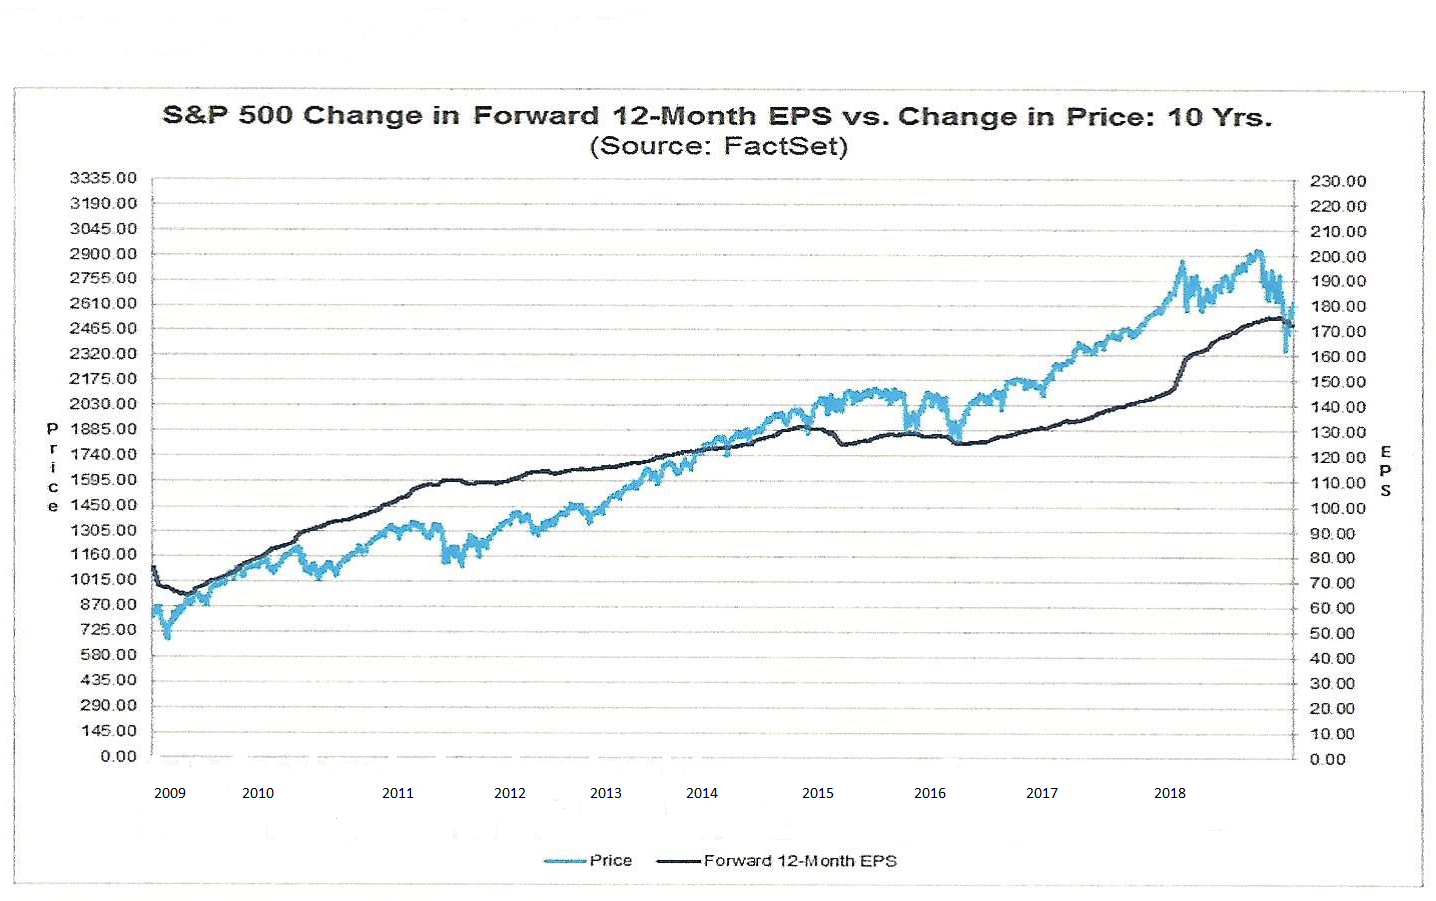
We have mentioned many times that the correlation between earnings and share prices is tight and this chart provides more evidence. When the S&P 500 trades below the earnings line (2009-2013), stocks are undervalued and eventually ‘catch up’ to the earnings line. When the S&P 500 trades above the earnings line (2014-2018) stocks are likely to eventually retrace and trade back down to the earnings line. This is what happened in the fourth quarter last year.
What is the graph telling us now? Currently, the S&P 500 index trades about in line with earnings which marks fair valuation. In numerical terms, the forward P/E on the S&P 500 is 15.5X, in line with its 10-year average. The market seems neither over or undervalued at this time, much different than a year ago when valuation was a major concern.