With Q1 2024 now complete, the S&P 500 index posted a return of 10.2%. That was good enough to beat the tech-heavy NASDAQ 100 and the blue-chip Dow Jones 30 on the large-cap front. It also beat both small-caps and mid-caps.
It is remarkable that we haven’t seen a one-day 2% drop in more than a year, and even more of a surprise that we haven’t seen a pullback of 2% from a closing high in 96 trading days going back to October 2023.
Please review the graph below of the S&P 500 ETF over the last six months. The trading range is incredibly tight – and unusual.
S&P 500 ETF (SPY): LAST SIX MONTHS
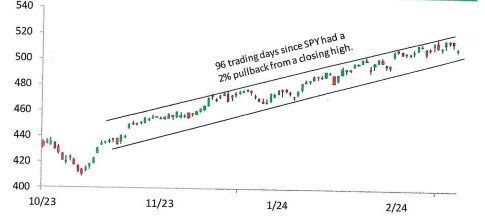
Source: Bespoke Investment Group
In our view, the reason for this lack of volatility is while the market keeps rising and (lately) most sectors have been participating, there has been a lot of day-to-day sector rotation where one sector rallies while another lags only to reverse the pattern the next day.
Even with the recent lack of volatility, everyone “knows” a correction is due and right around the corner. But how will some investors react when we eventually get a 5% or 10% drawdown after smooth sailing for this long? Sometimes investors forget that a 10%+ correction occurs on average once a year, and doesn’t mean the bull market is over. Multiple corrections usually occur in bull markets and can be quite scary (the S&P 500 dropped 19% in Q3 2011 during the 2009-2020 mega-bull market but quickly regained new highs). The only recent industry/sector correction is the semiconductor stock index last month – it plunged 11% from March 8th to March 19th.
The current bull market, which began October 2022, is still young by historical standards. In terms of length, the average bull market has lasted twice as long as this one. In terms of bull market gains, this bull’s 45% gain is still well below the median bull market gain of 77% and not even half the average bull market gain of 114%. We think we have a long way to go.
CAN THIS BULL MARKET TURN INTO A MEGA-BULL?
In the last section, we stated we think the current bull market has room to run. If history repeats (and, of course, there are no guarantees), we could have a couple of years left and/or an 80% gain to reach the average run. Time will tell. Could the bull market even extend beyond the averages and turn into a mega-bull like the 1987 (post-October crash) through March 2000 (dot.com peak), and March 2009 (post Financial Crisis) through February 2020 (pre-pandemic)? We present three factors that combined could be the spark that we need for this to turn into the Roaring 2020s.
First, AI has to prove itself as a major technological innovation like it is purported to be. The graph that follows identifies the introduction dates of major technological innovations since 1980. The release of ChatGPT in November 2022 is the beginning of the AI era for this purpose. Actually, companies have been working on AI technology prior to ChatGPT for years.
NASDAQ COMPOSITE AND MAJOR TECHNOLOGY RELEASES SINCE 1980 (LOG SCALE)
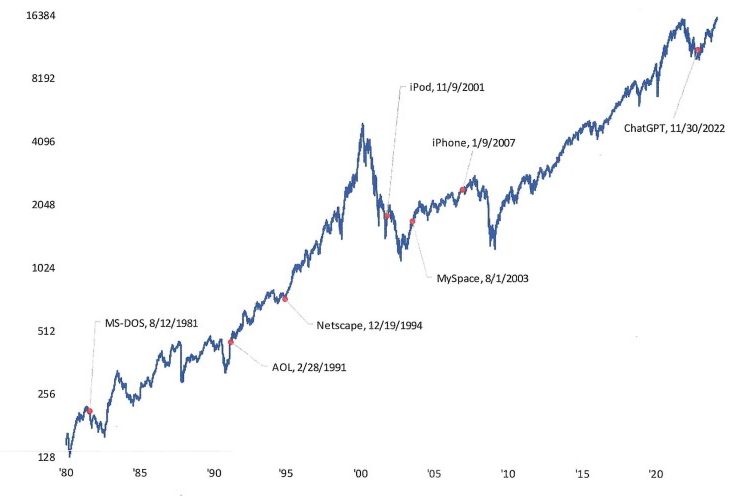
Source: Bespoke Investment Group
Will AI start a wave of increased productivity growth in our economy that we discussed last month? Will this potential productivity boom translate into higher profit growth directly attributable to AI? Both are possible.
Second, we are entering a new bull market for corporate earnings. If there is positive earnings growth for Q1 2024 (3.6% growth is forecast), it will mark the third straight quarter of year-over-year earnings growth for the S&P 500 index. And it only gets better from here. For calendar year 2024, analysts are projecting earnings growth of 11.0%, and 13.4% for 2025. With our strong economy, these earnings growth forecasts seem attainable. Accelerating earnings growth could result in multiple expansion pushing stock prices even higher. The forward 12-month P/E ratio for the S&P 500 is 20.9x. However, when you take out the “MAG 7”, the P/E ratio drops to about 18x. This compares to the 5-year average P/E of 19.1x and the 10-year average of 17.7x. So we don’t see valuation of the S&P 500 being in a bubble, far from it. Of course, some individual stocks (especially in tech) may be in a bubble, but that is always the case. Fair multiples combined with accelerating earnings growth are a recipe for higher stock prices.
Third, investors have put the Fed on the sidelines and are focused on other factors (like AI and earnings). The market’s rally this year came despite investors’ hopes of six rate cuts this year being reduced to two or three cuts. Some economists even say one and done. The assumption here is that inflation continues on its uneven path down to 2%. After a few bumpy CPI and PPI inflation prints earlier this year, last Friday’s release of the February PCE (personal consumption expenditures) and core-PCE should give investors comfort that inflation remains under control.
It is too early to assign a probability to having a mega-bull in the making. We will just say it’s possible. America’s innovation in AI and growing creativity combined with our democratic, entrepreneurial, and capitalist system could surprise us on the upside.