The number of stocks rising lately has increased even though this year’s winners have taken a breather. A bull’s dream is for the broader market to keep trending higher as investors rotate like this underneath the surface. Small caps and non-Mag 7 stocks have fully participated in the recent rally. Both groups have catching up to do as it has been a lost decade for many stocks in these categories.
At current levels, the small-cap index (Russell 2000) is at the same level it was at more than four years ago, so small caps have been dead money for some time. It has been about 950 trading days without a new all-time high, the third-longest drought on record (source: Bespoke Investment Group). Small caps won’t underperform forever. They need lower interest rates and a strengthening economy to get their mojo back, among other factors.
Many non-Mag 7 stocks have underperformed the Mag 7 for a decade. According to the Bloomberg 500 Index, the Mag 7 index is up 2800% versus a gain of just 129% for the non-Mag 7 since 2015 (source: Bespoke Investment Group). Most of the market’s huge gain over the last 10 years has come from the Mag 7.
Looking at investor sentiment, individual investors didn’t seem to get the message that stocks are at an all-time high. Bullish sentiment in the weekly AAII survey (American Association of Individual Investors) dipped back below 30% last week, while bearish sentiment jumped to 46.2%. This is upside down. Historically, in weeks when the S&P 500 hits a new high, the AAII bull/bear spread heavily favors bullish sentiment. Bears complain of investor complacency but the AAII survey suggests the opposite.
Finally, after the in-line CPI was announced last week, Fed Fund Futures were pricing in a 99.9% chance of a Fed rate cut at the September Fed meeting. That is as close to a guarantee as it gets. However, after the hot PPI reading, odds have been reduced to 88%, still a very high probability. We expect a 25 basis point cut in September.
Earnings season is almost over and it has been a very good one. Beat rates for both earnings and revenues were well above average. Guidance was also strong as twice as many companies raised guidance as lowered guidance. Bad guidance saw stocks get crushed. The average stock cutting guidance this season dropped an astounding 10.2% on announcement day (source: Bespoke Investment Group).
For the season, corporate earnings grew 11.8% year-over-year versus an expectation of 5.0% coming in (source: FactSet). This upside surprise has propelled the stock market to all-time highs. Profit margins have soared and are now at 13% as shown in the graph below:
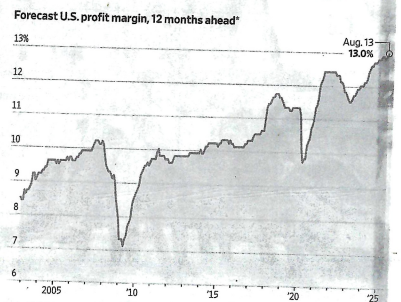
Source: LSEG
The historically high profit margins show that tariffs have not impacted corporate profitability to any large degree – at least not yet.
One caveat is that outside of the Mag 7, earnings growth this quarter was only in the low single digits. This has to get better for the broader market to continue to rally like it did last week.
Here are two market developments increasing demand for stocks – new issues and stock buybacks.
The IPO market is sizzling after a number of years when new issues were few. It is a sign animal spirits are back. A strong IPO market is typically a bullish signal. Many recent IPOs have had very strong performance, including Figma’s explosive start (up 250% on its first day of trading). Companies are lining up to go public in fall and 2026.
Second, U.S. companies are expected to repurchase $1.1 trillion of their own stock in 2025, according to Birinyi Associates. This would be the most since data started in 1982. Companies are flush with cash given good earnings, and many see their stocks representing good value. The buybacks are led by tech stocks with $100 billion pledged by Apple and $70 billion from Alphabet. Big banks are also big buyers – $50 billion by JP Morgan Chase and $40 billion from Bank of America.
STOCK RETURNS CRUSH BONDS
We recently came across an investment performance study by Bespoke summarizing stock and bond returns over the last 20 years. The results are eye-opening because of the magnitude of the difference.
Starting with S&P 500, the 17% gain over the last year is about 6% better than the long-term average, while the roughly 20% annualized gain over the last two years is nearly double the long-term average. Five and ten year returns are also well above the long-term average, while the 20-year annualized return is just barely below average (due to the Financial Crisis bear market in 2008).
For long-term U.S. treasuries (B of A/Merrill Lynch 10+ year Treasury Index), performance has been incredibly weak with annualized returns over one, two, five, and ten year periods all negative. Talk about a lost decade. The 20-year return is positive, but at 3.2% annualized, it ranks as the weakest of any 20-year period on record.
What lessons can investors learn from these historical returns? Here is our take:
1) Avoid long-term bonds. Buy short-term bonds instead. In many market environments, the income yield for short-term bonds is about the same as long-term bonds but price volatility is a lot less. When rates rise, short-term bond prices are fairly stable. Long-term bond prices can get crushed.
2) In balanced accounts, there should be a full allocation to stocks (based on risk tolerance, of course) even given the volatility of stocks. Remember, volatility is not risk. Volatility hurts only when investors are forced to sell at market bottoms. Otherwise, volatility presents opportunities to buy stocks cheaper and upgrade portfolios.
3) Stocks are the way to go to hedge against inflation.