IS IT ONLY TARIFFS?
The blame for the market’s drop lies squarely on the shoulders of tariffs. During the period when the markets recently rallied from March 14th through March 25th, there was very little “tariff talk.” When 25% auto tariffs were announced last Wednesday on the 26th, markets reversed which bled into Friday’s 700 point Dow loss.
A direct result of tariffs is massive capex risks. Current strong manufacturing data has an asterisk because of the potential impact of tariffs. We just saw a record high in industrial production for the first time since the 2010s, and factory construction volumes continue to soar. But capex plans are already being cut back.
Who knows what the market would be doing without tariff talk, but there are clearly other market concerns. One of them seems to be the markdown in the Q1 earnings growth forecast from 11% to 7% (source: FactSet). With earnings season starting next week, we will soon see Q1 results and guidance for the rest of 2025.
In addition, consumer expectations have cratered, but this seems to be largely based on political affiliation. Sentiment seems to be far weaker than the fundamentals suggest. Consumer balance sheets and income remain strong.
There has been a lot of damage done to the prices of individual stocks. Through yesterday, the S&P 500 index is down 8.5% off its peak, but the Mag-7 stocks have averaged a decline of almost 25%. Based on technical analysis, it is worth noting that the S&P 500 and NASDAQ 100 have both failed to hold their 200-day moving average. The 200-day is now locked in as the first high point for the market in its attempt to recover out of correction territory.
The stock market is never a one-way street. There are plenty of positives the bulls can point to. First, market breadth has held up very well. A positive divergence has opened up between the S&P’s cumulative advance/decline line and price. This means that in spite of lower index prices, the number of advancing stocks equals the number of declining stocks. See the graph below. Notice the A/D line has been flat.
S&P 500 PRICE VS. CUMULATIVE A/D LINE
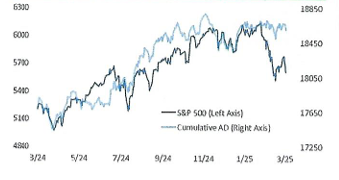 Source: Bespoke Investment Group
Next, the AI boom lives on despite a steep decline in AI stocks, in our view. The NASDAQ’s action since ChatGPT was released in November 2022 has been most correlated to the release of the Netscape web browser in late 1994. If the ChatGPT/Netscape pattern holds, this bull market has years of runway left. Look at the tight fit in the graph below:
NASDAQ COMPOSITE % CHANGE IN THE 3 YEARS AFTER NETSCAPE RELEASE VS. CHATGPT RELEASE
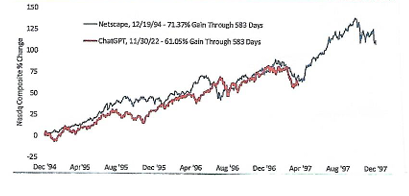 Source: Bespoke Investment Group
Labor markets have certainly cooled from rip-roaring levels observed coming out of the pandemic, but things still look healthy. Jobless claims and job openings have been stable and labor income has been strong.
Corporate profit margins remain very high relative to history, with Q4 2024 showing the highest corporate profits share of gross domestic income since the 1950s.
Inflation remains mostly stable for now. Although last week’s Personal Consumption Expenditures (PCE) release was disappointing, March CPI is forecast at just .01% month-over-month based on the Fed’s CPI Nowcast tool. Headline and core CPI along with PCE are all projected to have 2-handles on a year-over-year basis when March data is released in April. We do not fear a hawkish Fed at this point even with elevated tariff-related inflation expectations.
That’s a lot of information to digest. Bulls need the March 13th low to hold. Otherwise there may be more pain ahead. The average correction is about 15% historically, another 6% from current levels. But given that stocks are up roughly 75% of the time over all 12-month periods, bears are sticking their neck out if they expect stocks to be down over the next 12 months. We continue to focus on opportunities for our clients, both new stocks based on marked-down prices, and adding to existing shares in client portfolios.